
Hawk GUI: Facility Calibration
Performing live calibration (such as AC calibration or AC sweep) can be time consuming, especially when frequent tests occur using a particular set of equipment and the user has to perform calibrations each time he or she creates a new configuration file whilst still using the same acquisition hardware.
To avoid this time consuming situation the user can setup facility cals in advance. These can be recaptured after a certain period of time, and results from the new calibration and previous calibrations can be compared so as to check that the characteristics of the hardware have remained within acceptable norms.
To use this feature the user must create facility cals for the acquisition hardware at every bandwidth they want to use facility cals for. Once facility cals have been created, the calibration method of “Facility” is available for cal method one, when setting up configurations on the Channel Configuration screen. Facility can be used directly in place of using AC Response and AC Sweep. With Facility selected as the first cal method for a channel, the user can select either mV/EU or AC Spot as secondary cal methods.
When the user first enters the Facility Cal screen they are presented with controls as shown below.


- The type of facility cal for a particular bandwidth, i.e. “SWEEP” or “AC RESP”
- The bandwidths available are defined by the settings on the preferences screen.
- The voltage is set based on the type of acquisition hardware available.
- The user must specify the Peak mV Signal in EUs. This is similar to the response EU on the AC Cal tab of the channel configuration screen.
- Existing facility cal. Double click on an item to load up the corresponding facility cal details.
- If there are HGL controllable signal conditioners in use then the user can setup the signal conditioning settings.
- This button is used to perform the live facility cal, once all the facility cal parameters are setup. It will display a modified version of the calibration screen. All the channels are initially displayed; the user can deselect channels that he/she does not wish to calibrate. At the end of the calibration, a report is generated. The report is created for each channel and makes comparisons between current and previous calibrations. This way any variations in the response of the acquisition hardware can be seen. If the system is working correctly there should be negligible differences between successive facility calibrations.
- To view the cal graphs for the current facility cal and the previous facility cal for that bandwidth on a channel by channel basis.
- To view the calibration report for the precious two calibrations and the current one, again, on a channel by channel basis.

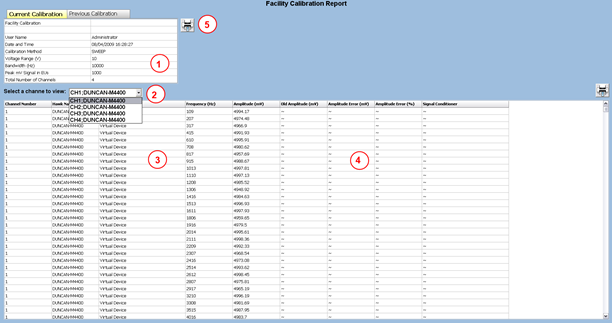
- General calibration details for the current facility cal for the selected bandwidth in the top grid.
- The user can use a drop down box to select from the channels that were calibrated for the selected bandwidth. After a channel is selected, its calibration information is available in the bottom grid.
- The acquisition hardware and signal conditioner hardware, cal point amplitudes and their corresponding frequencies.
- The previous cal’s corresponding amplitudes (in the example above, there isn’t one), the error in mV and the error in percent between the current and previous cal points.
- To print the report.

The graph shows the current facility cal as a red line and the previous facility cal (if there is one) as a green line. The user can see the amplitude in mV or ADC counts. The graph can also be printed out using the print button just above of the graph area.