
Dataviewer: Phase Analysis
Before using any values generated by cross spectral analysis, ensure that the phase measurement is calculated correctly for the application. Check the phase settings in the Options menu. Phase can be calculated as centered (-180 to 180 degree), lagging (0 to 360 degrees) or leading (-360 to 0 degrees). Additionally, a fixed offset can be applied. The default setting is centered with no offset.
Cross Spectral Analysis in Aurora (vs. Speed)
In order to create a polar-bode or cross spectral analysis plot where a channel in analyzed against a tachometer, the user must first create a standard Z-Mod file using the following parameters:
| Analysis Type | Standard Zmod |
| Output Type | Complex |
| Reference | Speed (N1,N2,N3) |
| Ref Limits (Speed) | 0-100% |
Include the channels desired for analysis. It is not necessary to include the tachometer channel.

Once the job has been submitted and processed in Tornado, open the Z-Mod file in Aurora Dataviewer.
Next, go to the Cross-Spectral analysis tab.

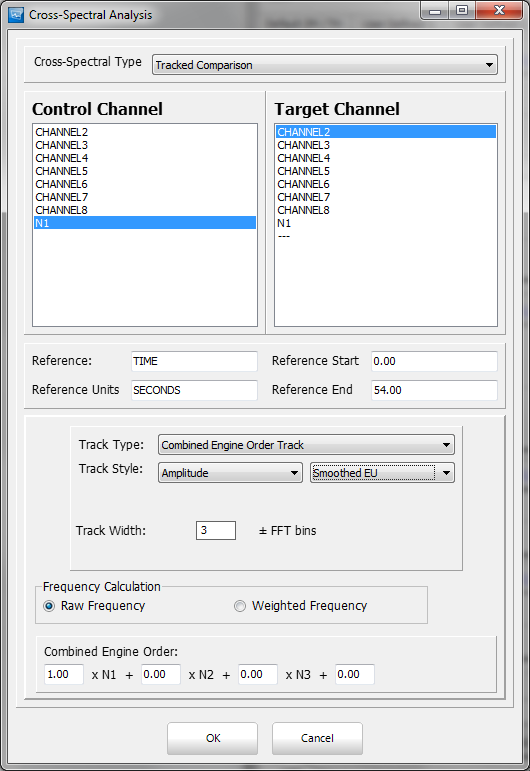
On this page you will perform a Tracked Comparison using a tachometer and the channel you wish to analyze. Set the the tachometer you wish to reference as the "Control" and the channel you wish to analyze as the "Target."
When specifying the EO, there is the option for how tightly the EO will be tracked in terms of number of bins. To tightly follow the EO line, use +/- 1 bin, to better follow the nearest response use +/- 3 bins.

Once the analysis is complete, the screen will show five plots:
- Coherence vs Speed
- Phase vs Speed
- Frequency vs Speed
- Amplitude vs Speed
- Polar plot.

Currently, the shapes and positions of the various plots need reworking to better fit with a traditional formatting of a Polar/Bode plot, but all the necessary information has been calculated.
Right click on any plot to save the data points to a CSV.
Cross Spectral Analysis in Aurora (vs. Time)
In order to create a polar-bode or cross spectral analysis plot where a channel in analyzed against a tachometer, the user must first create a standard Z-Mod file using the following parameters:
| Analysis Type | Standard Zmod |
| Output Type | Complex |
| Reference | Time |
| Ref Limits (Time) | 0-100%
|

Once the job has been submitted and processed in Tornado, open the Z-Mod file in Aurora Dataviewer.
Next, go to the Cross-Spectral analysis tab.
On this page you will perform a Tracked Comparison using a tachometer and the channel you wish to analyze. Set the the tachometer you wish to reference as the "Control" and the channel you wish to analyze as the "Target."
When specifying the EO, there is the option for how tightly the EO will be tracked in terms of number of bins. To tightly follow the EO line, use +/- 1 bin, to better follow the nearest response use +/- 3 bins.

Once the analysis is complete, the screen will show four plots:
- Coherence vs Time
- Phase vs Time
- Frequency vs Time
- Amplitude vs Time
- Polar plot.

Currently, the shapes and positions of the various plots need reworking to better fit with a traditional formatting of a Polar/Bode plot, but all the necessary information has been calculated.
Right click on any plot to save the data points to a CSV.
Obtaining Phase Information for Trim Balance Pro
A slight variation on these steps is in necessary to obtain phase information when using Trim Balance Pro. In order to obtain the information for Trim Balance Pro reference to time when creating the Complex ZMOD and set the power factor to the same power factor as used during Real Time Monitoring. After creating the complex ZMOD you will not be able to change the power factor.

When setting up the Track Comparison set the "Track Style" to "Smoothed EU" in order to obtain the proper amplitude. Set the engine order you wish to follow and then click "OK." See example below.
The follow plots will appear as mentioned above.
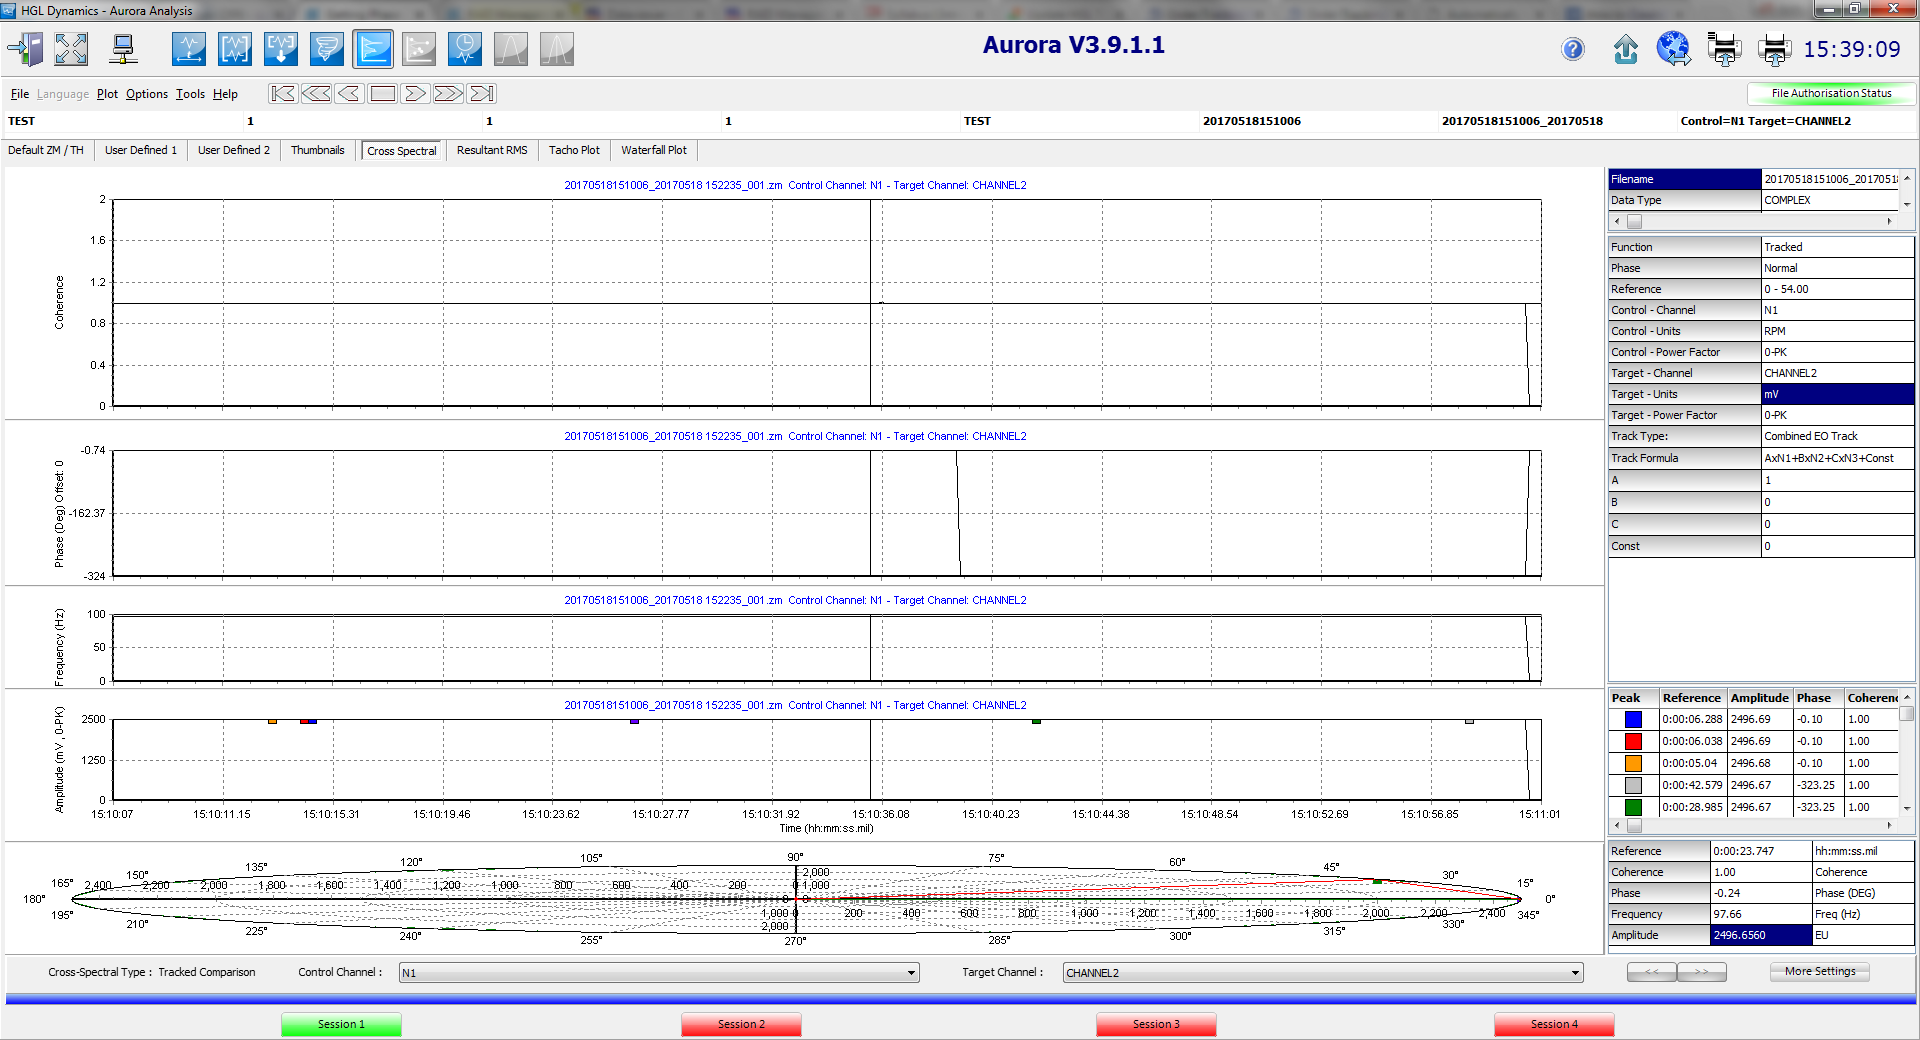 Currently, phase information for the response is best seen on the phase plot, second from the top. Amplitude values for the tracked comparison can be found on the amplitude plot second from the bottom.
As the plots may be a bit difficult to read, obtain the phase and amplitude information you may want to either right-click and export to a CSV or place a cursor on the screen and note the value in the lower right-hand table. If the phase value is negative assume absolute value. Keep in mind that the amplitude you are seeing has a power factor that was defined when you processed it in Tornado and is not impacted by the power settings on the Default ZM/TH Tab in DataViewer.