
Hawkeye: FFT Plot
The FFT service provides a 1024-point FFT (1k points), at an update rate of 1, 2, 5, 10 or 20 Hz. It provides the user with the ability to zoom in (by down-sampling) and scroll along the frequency axis (by base-band shifting). The data values are displayed in the FFT and Campbell instruments.
FFT plot
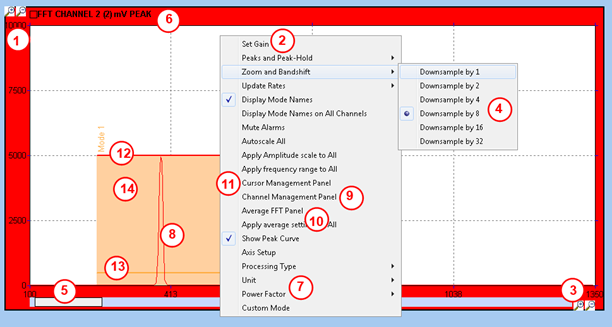
- Amplitude scale is configurable via the gain panel, the +/- zoom buttons, or by clicking on the scale max or min value, and typing the value directly.
- Access to the gain panel via mouse right click popup menu
- Frequency scale, configurable via -+ zoom button, or “zoom and bandshift” menu option (4)
- Frequency zoom options. The downsampling is achieved by the FFT service by applying a low pass filter + decimation on the data, before computing the FFT. Therefore, any other FFT / Campbell plot displaying the same channel will look at the same bandwidth. On the example above, the FFT is currently down-sampled by a factor of 8.
- Band shift scrollbar. Band shifting is done by the FFT service on the down-sampled signal, before computing the FFT.
- Name, number of channel on display, with units and power factor.
- Menu options to change the unit / power factor. Unit conversion facility allows integration, differentiation between acceleration, velocity and displacement units.
- The live FFT trace (1k FFT, so 410 spectral lines covering the bandwidth on display)
- Channel management panel, to change the channel on display, or display multiple channels on the same instrument (provided they have the same acquisition units).
- Average FFT panel, to overlay an averaged FFT on top of the live trace. Average duration is configurable.
- Cursor management, to add fixed frequency / peak / order track / harmonic cursors. Those are also available in the “FFT cursors” section of the settings panel (See “FFT cursors” section below)
- In the example above, we have triggered an alarm defined on a mode called “Mode 1”. The horizontal red bar is drawn at alarm level; its width shows the frequency range over which the alarm is active.
- The orange horizontal bar shows the warning level.
- We are above warning level, but below alarm level, so the alarm area is shown in orange.
FFT cursors
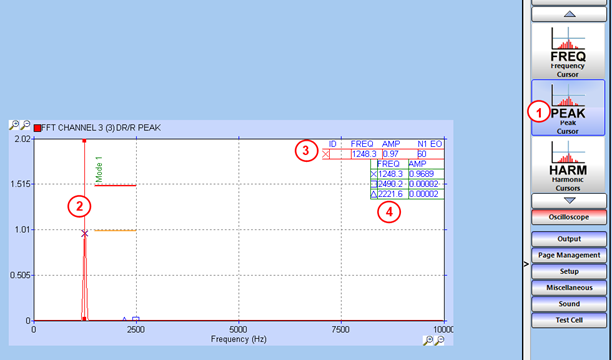
- Click on peak cursor “push button” in the settings panel, in section “FFT cursors”. Then click on the graph to drop the peak cursor at the frequency of choice.
- The peak cursor is displayed with a vertical line. It will look for the highest peak in a 10 bin region around its current position (5 bins on each side) and adjust its position accordingly
- The cursor table show the cursor symbol, frequency, amplitude, and for each speed channel, the order number and value corresponding to the cursor frequency.
- The peak table is shifted below the cursor table.
Use the same procedure to add a fixed frequency cursor or a harmonic cursor, using the appropriate button from the settings panel.
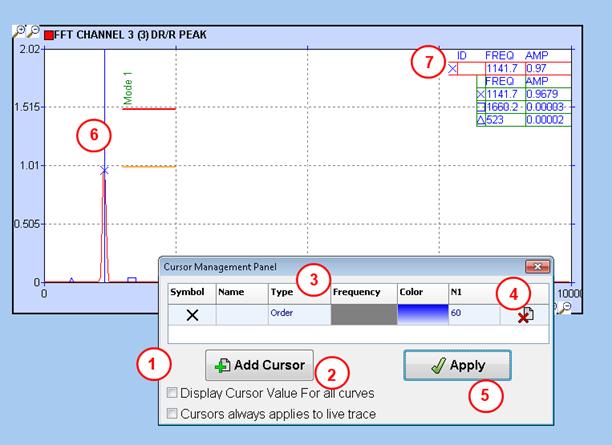
- Cursor management available via the right click popup menu
- Click on this button to add a new cursor. This will add a line in the grid above.
- Choose the cursor type (fixed frequency, peak, harmonic, or order), symbol and colour. For order cursors, specify the combined order across all speed channels available. In example above, we are tracking order 60 on channel N1.
- Click on the cross icon to delete an existing cursor.
- Click on this button to apply all changes made. Closing the panel without applying will invalidate all changes.
- The order cursor, with a blue vertical line.
- The cursor table shows the order track cursor frequency and amplitude.
Note that to delete a cursor, you can also click on its vertical line in the graph, and then press the delete key.
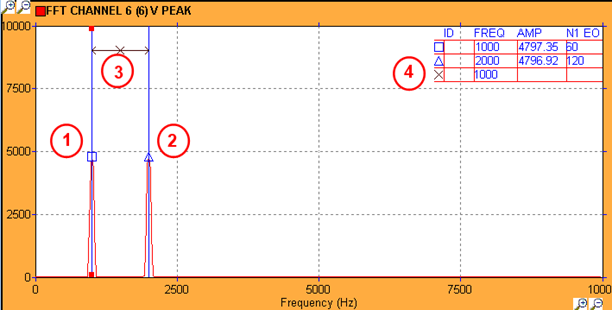
- Add a fixed frequency cursor
- Add a second fixed frequency cursor
- Select on frequency cursor, then CTRL click on the second frequency cursor to add a delta frequency cursor between the two.
- The cursor table show the delta frequency (cursor with the black cross).