
Hawkeye: Multiline Strip Chart Plot
Hawkeye's Multiline plot displays data from the DAS output service and standard acquisition into a a time based format. For the Multiline plot to display the data from the DAS Output service a Proc Settings.ini file must be created. For information setting up a Proc Settings.ini file refer to DAS Output: setting up Proc Settings.ini.
To use the Multiline plot it must first be added to a Hawkeye display. To add the Multiline plot to a display in Hawkeye follow the steps in Hawkeye: Custom Display Setup, the Multiline plot is under Miscellaneous in the tool box panel.
Once a Multiline plot has been added to Hawkeye and the Proc Settings.ini file is setup it will be ready to use.
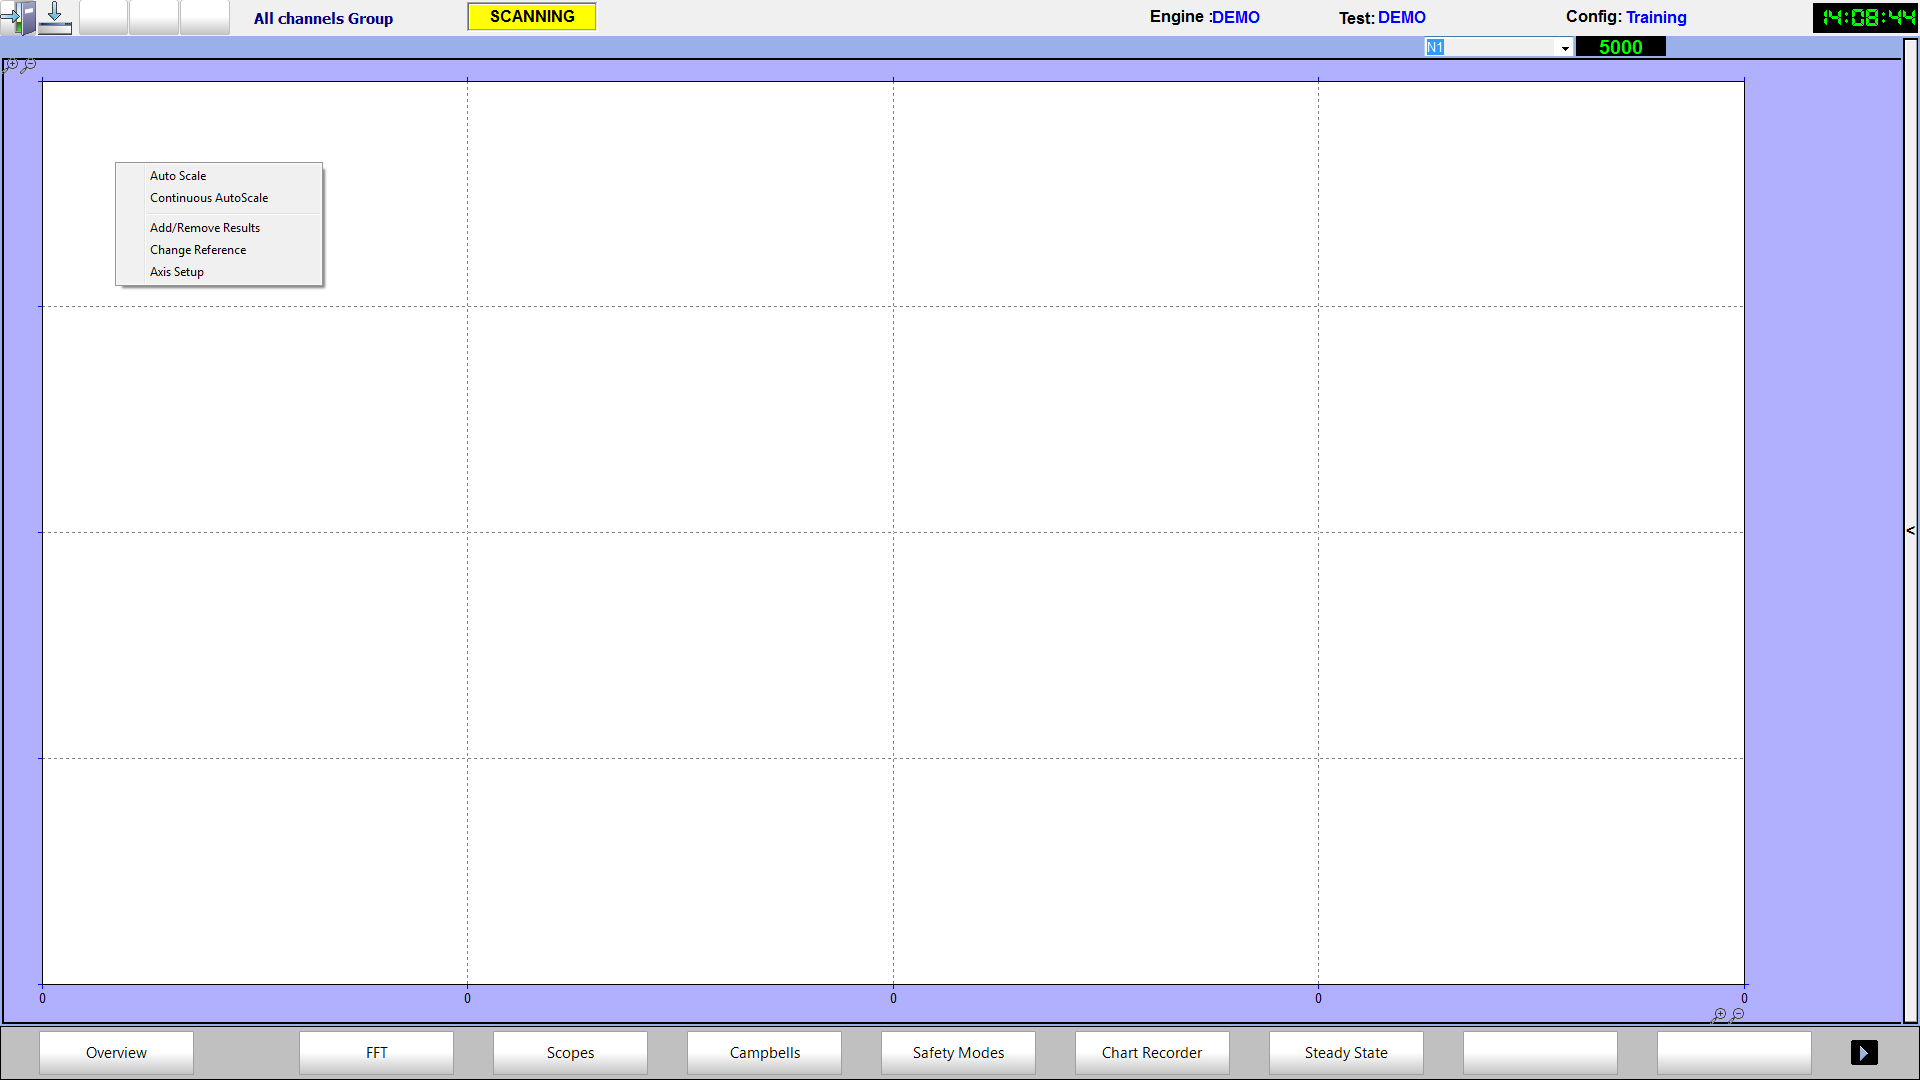 Right Click Menu
 Right Click Menu
- Auto Scale - Clicking this will auto scale to the current values that are being seen
- Continuous AutoScale - continuously auto scales the plot to the values displayed
- Add/Remove Results - Brings up the results panel where results can be added or removed
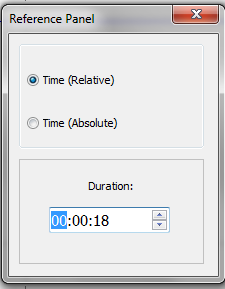
- Change Reference - Changes the time scale reference from absolute time to relative time, also allows for the time base to be adjusted
- Axis Setup - Allows for a second axis to be added as well as selecting the unit type and display units of each axis

Adding Results
To add results follow the steps below
- Right click on the plot and select 'Add/Remove Results'
- If no results are currently displayed, it will go straight to the add result page
- If results are currently displayed, it will go to the result page, click 'Add Result
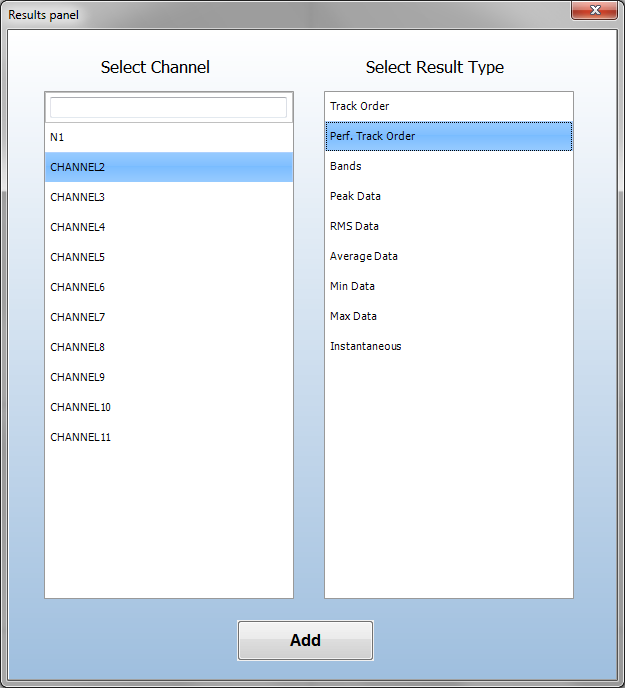
- First select a channel in the left window
- Select the desired result type
- Click Add
- A window will appear where the user can change the color of the line
- Double click on the color and select a new one
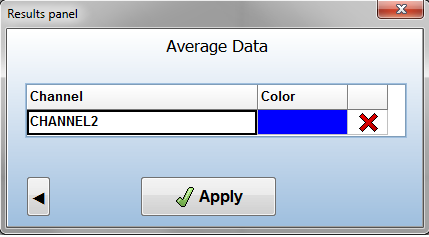
- Double click on the color and select a new one
- Once finished click apply and the line will appear.


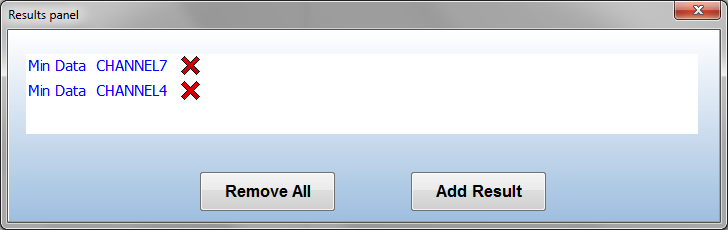
Removing a Result
To remove a result follow the steps below
- Right click on the plot and select Add/Remove Results
- In the results page find the result of interest
- Click the red X next to result to be removed or select 'Remove All' to remove all results

Setting up Axis

- Right click on the plot and select 'Axis Setup'
- Select the number of axes from the drop down
- Using the drop downs select the unit types and display units of the left and right axes