
Dataviewer: Displaying Frequency Data
- By default, the "Default ZM/TH tab is selected. It is the default layout of the composite Zmod
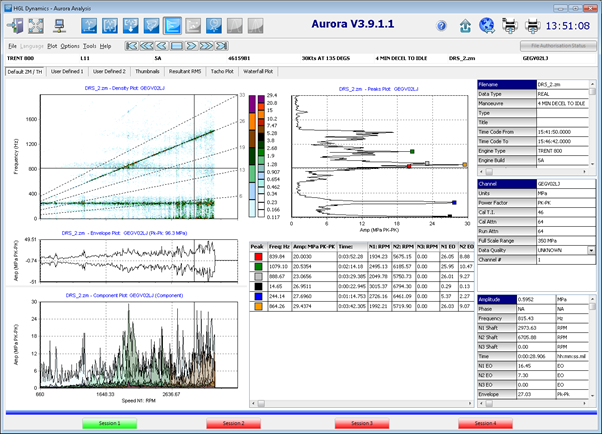 Note: Although it is also possible for the user to move and resize any of the components on the default display. Another option is to create a user defined layout from scratch via the user defined tabs "User Defined 1/ User Defined 2. See Dataviewer user guide for details
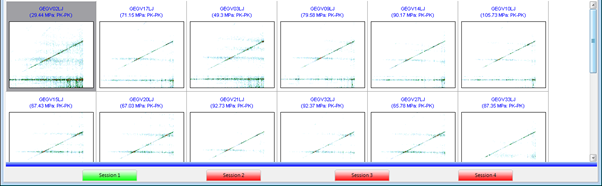
 - Thumbnail plots can be displayed by selecting the blue horizontal bar along the bottom of the default layout screen.
- While in the Composite view if you wish to magnify part of the density plot, swipe an area, from left to right, while holding down the left mouse button.

- When the swipe orientation is completed by releasing the left mouse button, the pixel resized image is displayed in the Z-mod plot area.
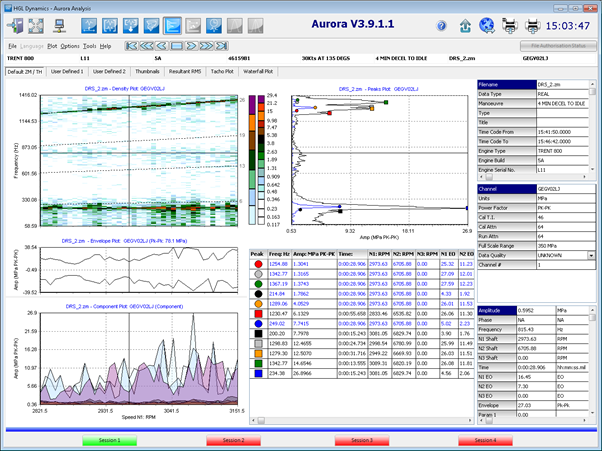
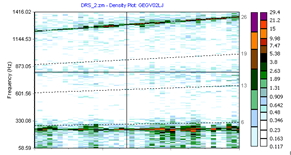 This only does an image zoom on the data in the composite display and does not do any re-analysis, so there is no change in the frequency resolution or amplitude accuracy from this function.
 - To return the data to its full size in the density display, click with the left mouse button on the density plot and swipe upwards to the left
 Note: Although it is also possible for the user to move and resize any of the components on the default display. Another option is to create a user defined layout from scratch via the user defined tabs "User Defined 1/ User Defined 2. See Dataviewer user guide for details


 This only does an image zoom on the data in the composite display and does not do any re-analysis, so there is no change in the frequency resolution or amplitude accuracy from this function.